Hi there, We have update our data analytics control designed to provide you with even more powerful and flexible data analysis capabilities. With these updates, we aim to make it easier for you to extract meaningful insights from your data.
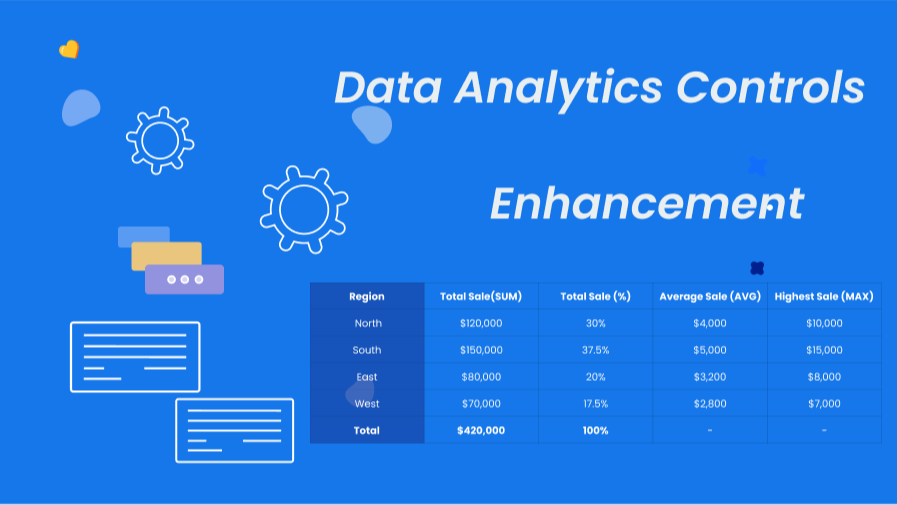
What’s New in Data Analytics Controls?
Our recent enhancements include a suite of powerful features that extend the functionality and usability of data analytics within our platform:
- Save Value to Variable in Summary: Now, you can save summary values directly to variables within yourSummarycontrol. This feature allows for more dynamic data manipulation and easier showing your data in the dashboard.
- Percent of Total in Pivot table: Enhance your data visualization by displaying values as a percent of the total directly within yourPivot table. This addition is perfect for quickly understanding proportions and distributions within your datasets.
- Support for Calculation Field: Each data analytic control now supports th calculation fields, enabling you to display complex calculation values within the visualization interface. This feature adds a layer of depth to your data analysis, allowing for more sophisticated insights.
These enhancements are designed to empower you with a more comprehensive and flexible toolkit for your data analysis needs. Whether you're creatingpivot tables,summary,gauge charts,line charts,column charts, orpie charts, these new features will enhance your ability to analyze and visualize data effectively.
Learn More and Get Started
To dive deeper into how these new features can enhance your data analytics capabilities and to get started with utilizing them, we encourage you to visit our support center and explore the following resources: